
In this guide
- Step 1: Start with the trend on the daily chart
- Step 2: Mark Bitcoin support and resistance
- Step 3: Find the next BTC target
- Step 4: Confirm with volume, momentum and derivatives
- Step 5: Check the news and the calendar
- Step 6: Plan the trade and the risk
- Short-term vs long-term Bitcoin forecasts
- How Alice helps with Bitcoin analysis
- Frequently asked questions
"Where is Bitcoin going next?" is one of the most searched questions in finance. Nobody can tell you the exact future price, and anyone who promises a guaranteed Bitcoin price prediction is selling something. What professionals do instead is build scenarios: if BTC holds this support, the next target is there; if it breaks, the next level is here. This guide shows you how to build that kind of BTC price prediction yourself, in about ten minutes a day.
Step 1: Start with the trend on the daily chart
Every good BTC analysis starts from the top. On the daily chart, ask one question: is Bitcoin making higher highs and higher lows (uptrend), lower highs and lower lows (downtrend), or moving sideways?
- In an uptrend, your Bitcoin price prediction should lean bullish and you look for buy zones at support.
- In a downtrend, lean bearish and look for sell zones at resistance.
- In a range, trade from one side to the other, or wait for the breakout.
The 200-day moving average is a useful second filter. Bitcoin above a rising 200-day average has historically been a healthier market than Bitcoin below a falling one.
Step 2: Mark Bitcoin support and resistance
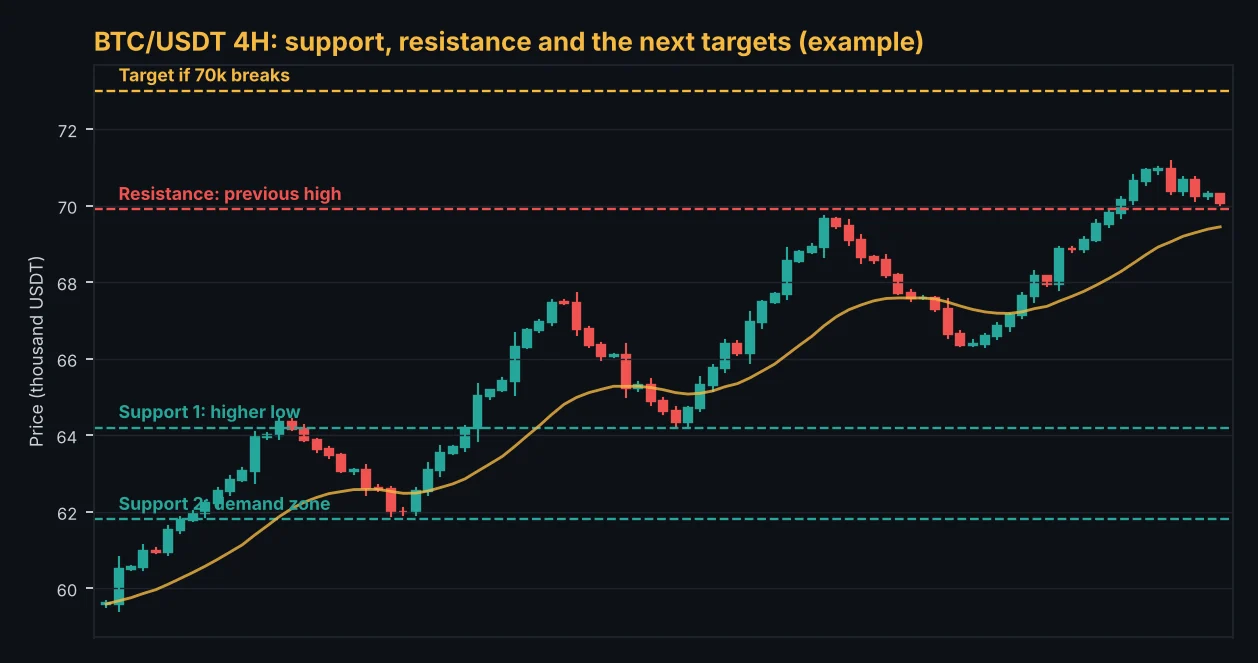
Bitcoin support and resistance levels are prices where buyers or sellers stepped in before. Mark them on the daily and 4-hour charts:
- Previous swing highs and lows: the clearest levels on any chart.
- Round numbers: 60,000, 65,000, 70,000 and so on attract orders and headlines.
- Breakout levels: an old resistance that broke often becomes new support (the "support and resistance flip").
- The weekly open and the monthly open: many large traders use them as reference prices.
Draw levels as zones, not thin lines. Bitcoin regularly wicks a few hundred dollars past a level before reversing.
Retracement and extension levels from a swing. Free, no sign-up.
Open the fibonacci calculatorStep 3: Find the next BTC target
Your BTC next target is simply the next zone in the direction of the trade:
- If BTC is bouncing from support, the first target is the nearest resistance above.
- If BTC breaks resistance and closes above it, the next target is the following resistance, or a Fibonacci extension (127.2% or 161.8%) of the last swing when price is at new highs.
- If support breaks, the next level below becomes the target for sellers.
Write it down as a plan: "Above 64,000 the bias is bullish with targets at 67,500 and 70,000. A 4-hour close below 61,800 cancels this and opens 58,000." That is a professional Bitcoin price prediction: clear, testable and with an exit if you are wrong.
Step 4: Confirm with volume, momentum and derivatives
Levels tell you where; confirmation tells you whether the move is real.
- Volume: breakouts with rising volume follow through more often. Breakouts on falling volume are often fakeouts.
- RSI: RSI above 50 supports bullish scenarios; bearish divergence at resistance warns that buyers are tired.
- Funding rates and open interest: very positive funding and fast-rising open interest mean many traders are long with leverage. That fuel can drive a squeeze lower if support breaks.
- Spot ETF flows: strong inflows into spot Bitcoin ETFs have become one of the biggest drivers of BTC demand.
Scores from 0 to 100 on every timeframe, whale radar, funding and open interest, and Best Trades with entry, stop loss and targets.
Step 5: Check the news and the calendar
Bitcoin reacts strongly to US data and central banks. Before you trust your BTC price prediction today, check the economic calendar for CPI inflation, non-farm payrolls and Fed (FOMC) decisions. A big release can push price through any level within minutes. Crypto-specific news such as ETF decisions, exchange hacks, regulation and large liquidations matters too, which is why the Alice news page marks high-impact headlines.
Step 6: Plan the trade and the risk
A prediction is only useful with a plan:
- Entry: at support in an uptrend, or after a confirmed breakout and retest.
- Stop loss: beyond the zone that would prove you wrong, plus a small buffer.
- Size: risk 1% or less of your account per trade. Calculate it from the stop, not from how confident you feel.
- Targets: the next resistance zones. Many traders take partial profit at the first target and move the stop to break-even.
Lots and units from your risk and stop loss. Free, no sign-up.
Open the position size calculatorShort-term vs long-term Bitcoin forecasts
Short-term BTC analysis (hours to days) depends on levels, momentum and news. A long-term Bitcoin forecast (months to years) depends on adoption, ETF demand, liquidity from central banks and the four-year halving cycle. Do not mix them: a long-term bullish view does not stop a 15% drop next week, and a short-term sell setup does not mean the bull market is over.
How Alice helps with Bitcoin analysis
The Alice scanner scores BTC and every other coin from 0 to 100 on every timeframe, the BTC deep analysis gives a daily verdict with key levels, entry, stop loss and two targets, and the whale radar shows large orders and unusual activity as it happens. Set a price alert at your key levels so you do not have to watch the chart all day.
Free daily analysis, key levels and market updates from the Alice team.
Frequently asked questions
Can anyone predict the Bitcoin price exactly?
No. Professional traders work with scenarios and probabilities: where the trend points, which levels matter and where the idea is wrong. That is more useful than a single number.
What is the most important Bitcoin support level?
The most recent higher low on the daily chart in an uptrend, or the most recent major low in a downtrend. Round numbers and old breakout levels come next.
Which timeframe is best for BTC analysis?
Use the daily chart for direction, the 4-hour chart for levels and the 1-hour or 15-minute chart for the entry.
Does news really move Bitcoin?
Yes. US inflation data, Fed decisions, ETF flows and regulation can move Bitcoin several percent in minutes. Always check the economic calendar before trading.
This guide is for education only and is not financial advice. Trading involves a high risk of loss. Test any method on a demo account first and never risk money you cannot afford to lose.
Keep learning
 Crypto
Crypto Futures Trading for Beginners: Long, Short, Leverage and Liquidation
Learn crypto futures trading step by step: how long and short positions work, leverage and margin, liquidation price, funding fees, and the risk rules that keep futures traders in the game.
 Crypto
Best Time to Trade Crypto: Volume and Volatility by Hour and Day
Crypto trades 24/7, but not every hour is equal. When crypto volume peaks, why the US session matters, how weekends differ, and how to pick your trading hours.
 Crypto
Bitcoin Halving and Market Cycles Explained
What the Bitcoin halving is, the dates of every halving so far, how past cycles played out, and what traders should and should not expect from the four-year cycle.