
In this guide
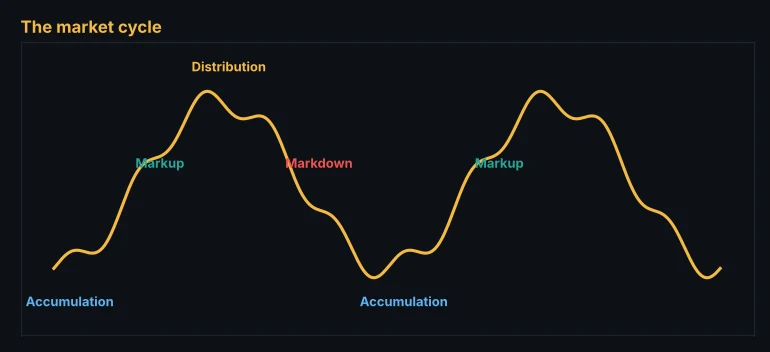
Markets move in cycles. Prices rise, run out of buyers, fall, run out of sellers, and the process repeats on every timeframe from 5-minute charts to multi-year Bitcoin cycles. Richard Wyckoff described this rhythm a century ago, and his four phases are still one of the clearest ways to understand where a market is and what is likely to come next.
Phase 1: Accumulation
After a long decline, price moves sideways in a range. Sellers are exhausted, and large buyers quietly build positions without pushing price up too fast. Signs of accumulation:
- A sideways range after a downtrend.
- Volume spikes on drops that do not lead to much lower prices.
- A final drop below the range (a spring) that quickly reverses back inside.
- Higher lows forming inside the range toward the end.
Phase 2: Markup
Price breaks out of the range and trends higher. This is the phase most traders want to catch. Pullbacks are shallow, breakouts hold, and moving averages slope up. The classic way to trade it is to buy pullbacks to support and moving averages.
Phase 3: Distribution
After a strong advance, price moves sideways again. This time large holders are selling to late buyers. Signs of distribution:
- A range after a long uptrend.
- A push above the range (an upthrust) that fails and falls back inside.
- Lower highs inside the range.
- Heavy volume on drops and light volume on rallies.
Phase 4: Markdown
Price breaks below the range and trends lower. Rallies are sold, support levels break, and moving averages turn down. Traders who bought in distribution are trapped and their selling fuels the decline.
How to use the cycle in practice
- Identify the phase on a higher timeframe. Is the daily chart trending or ranging after a trend?
- Trade with the phase. Buy pullbacks in markup, sell rallies in markdown, and stay patient in ranges.
- Watch the edges of ranges. Springs and upthrusts are high-quality reversal signals when they are followed by a break of structure.
- Respect the bigger cycle. A 1-hour markup inside a daily markdown is a counter-trend trade with smaller targets.
The crypto cycle
Bitcoin has shown a pronounced multi-year cycle around its halvings: long accumulation after a crash, a powerful markup, euphoric distribution, and a deep markdown. Altcoins tend to amplify each phase. Knowing the phase helps you avoid buying euphoria and selling capitulation.
Profit, loss and ROI including fees. Free, no sign-up.
Open the crypto profit calculatorMistakes to avoid
- Calling the top or bottom of a cycle without confirmation.
- Treating every range as accumulation. Ranges in a downtrend are often re-distribution before another leg down.
- Ignoring the timeframe. Every timeframe has its own cycle, and they do not always agree.
See the phase in Alice
The Alice scanner's score combines trend, structure, momentum and the higher timeframe, so a market in markup scores high and one in markdown scores low. Ranges show as neutral scores. The Elite whale radar adds money flow and large orders, which are often visible during accumulation and distribution.
The Alice scanner scores every crypto, forex, gold and index market from 0 to 100 on every timeframe, so you can spot these setups in seconds.
Open the free web appFrequently asked questions
How long does each phase last?
There is no fixed length. On a daily chart a phase can last weeks or months. On a 15-minute chart it may last a few hours.
Is the Wyckoff method still useful today?
Yes. The tools have changed, but supply and demand still drive prices, and large participants still need time to build and unload positions.
Can I trade inside the range?
Yes, by buying near support and selling near resistance with tight stops, but ranges are also where false breakouts and sweeps happen most. Many traders wait for the breakout instead.
This guide is for education only and is not financial advice. Trading involves a high risk of loss. Test any method on a demo account first and never risk money you cannot afford to lose.
Keep learning
 Strategy
Fibonacci Retracement Trading Guide: Levels, Golden Zone and Targets
How to draw Fibonacci retracements correctly, which levels matter (38.2%, 50%, 61.8%), how to use the golden zone for entries and extensions for targets, with examples.
 Strategy
How to Use a Market Scanner to Find Better Trades Faster
A practical guide to market scanners for crypto, forex and gold. What a scanner score means, how to filter by timeframe, how to go from a scan to a planned trade, and the pitfalls to avoid.
 Strategy
RSI Indicator Explained: Settings, Divergence and How to Trade It
The Relative Strength Index made simple. How RSI is calculated, what overbought and oversold really mean, the best settings, divergence, and the mistakes that cost traders money.