
In this guide
The Relative Strength Index, or RSI, is one of the most popular indicators in trading, and one of the most misunderstood. Many traders sell every time RSI goes above 70 and buy every time it drops below 30, then wonder why strong trends run straight over them. Used properly, RSI tells you a lot about momentum and when a move is losing steam.
What RSI measures
RSI was introduced by J. Welles Wilder in his 1978 book New Concepts in Technical Trading Systems. It compares the size of recent gains with the size of recent losses and turns the result into a number between 0 and 100.
RSI = 100 − 100 ÷ (1 + Average gain ÷ Average loss)
The standard setting uses the last 14 candles. When most of the recent movement is up, RSI rises toward 100. When most of it is down, RSI falls toward 0. Around 50, gains and losses are roughly balanced.
Overbought and oversold, properly understood
The classic levels are 70 (overbought) and 30 (oversold). But "overbought" does not mean "about to fall". It means price has risen fast compared with its recent history.
In a strong uptrend, RSI can stay above 70 for a long time, and every dip to 40 or 50 can be a buying opportunity. In a strong downtrend, RSI can sit below 30 while price keeps falling. Selling simply because RSI is above 70 is fighting the trend.
A more useful way to read the levels:
| RSI zone | What it usually means |
|---|---|
| Above 70 | Strong upward momentum, stretched in the short term |
| 50 to 70 | Bullish momentum |
| 30 to 50 | Bearish momentum |
| Below 30 | Strong downward momentum, stretched in the short term |
The RSI range shift
In uptrends RSI tends to stay between about 40 and 80; in downtrends between about 20 and 60. When RSI stops reaching 70 and starts failing below 60 after a long uptrend, momentum has changed even if price has not yet broken down.
RSI divergence
Divergence is when price and RSI disagree.
- Bearish divergence: price makes a higher high, but RSI makes a lower high. The new high was made with less momentum.
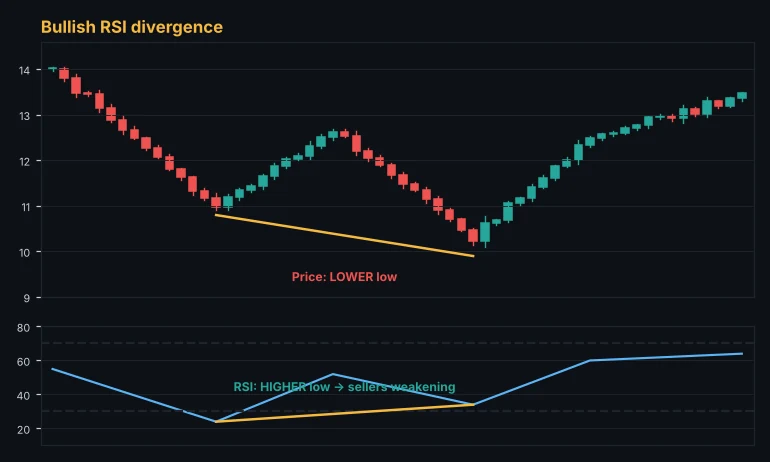
- Bullish divergence: price makes a lower low, but RSI makes a higher low. Sellers are pushing with less force.
Divergence is a warning, not a signal on its own. In strong trends you will see several divergences in a row before price finally turns. Wait for confirmation, such as a break of market structure or a close back through a key level, before acting.
Best RSI settings
- 14 is the standard and works on every timeframe.
- 7 to 9 reacts faster and suits short-term trading, with more false signals.
- 21 to 25 is smoother and better for swing trading.
Rather than tweaking settings, it usually pays to keep 14 and pay attention to the timeframe and the trend.
Three practical ways to use RSI
- Trend pullbacks. In an uptrend, wait for RSI to cool to the 40 to 50 area while price pulls back to support, then look for a bullish candle to enter.
- Momentum confirmation. A breakout above resistance with RSI pushing above 60 is stronger than one where RSI barely moves.
- Exhaustion warnings. After a long move, divergence plus a break of a short-term trend line can signal it is time to take profit.
Common RSI mistakes
- Shorting every overbought reading in a bull market.
- Using RSI alone with no idea of the trend or key levels.
- Changing the settings until old signals look perfect.
- Ignoring the higher timeframe: a 15-minute RSI signal against a strong daily trend is low quality.
How Alice uses RSI
The Alice scanner includes RSI in the momentum part of every market's 0 to 100 score, together with MACD and the stochastic oscillator, and combines it with trend, volume, structure and the higher timeframe. You can also set an RSI alert on any market, so the server tells you when RSI crosses a level you choose.
The Alice scanner scores every crypto, forex, gold and index market from 0 to 100 on every timeframe, so you can spot these setups in seconds.
Open the free web appFrequently asked questions
What is the best RSI level to buy?
There is no single level. In an uptrend, dips toward 40 to 50 often offer better entries than waiting for 30, which may never come. In a range, readings near 30 at support can work.
Does RSI work for crypto?
Yes, it works on any liquid market. Crypto trends can be extreme, so overbought and oversold readings can last a long time; focus on divergence and range shifts.
Is RSI a leading or lagging indicator?
It is calculated from past prices, so it lags a little, but divergence can warn of a turn before price confirms it.
This guide is for education only and is not financial advice. Trading involves a high risk of loss. Test any method on a demo account first and never risk money you cannot afford to lose.
Keep learning
 Strategy
Fibonacci Retracement Trading Guide: Levels, Golden Zone and Targets
How to draw Fibonacci retracements correctly, which levels matter (38.2%, 50%, 61.8%), how to use the golden zone for entries and extensions for targets, with examples.
 Strategy
How to Use a Market Scanner to Find Better Trades Faster
A practical guide to market scanners for crypto, forex and gold. What a scanner score means, how to filter by timeframe, how to go from a scan to a planned trade, and the pitfalls to avoid.
 Strategy
Smart Money Concepts (SMC) for Beginners: Order Blocks, FVG and Liquidity
A clear introduction to smart money concepts. Market structure, BOS and CHoCH, order blocks, fair value gaps, liquidity sweeps and premium and discount zones, explained simply.