
In this guide
There are hundreds of crypto pairs, dozens of forex pairs and thousands of stocks. Nobody can flick through all those charts every hour. A market scanner does the first pass for you: it checks every market against a set of conditions and shows you only the ones worth a closer look. Used well, it saves hours and stops you forcing trades on boring charts.
What a scanner does
A scanner applies the same rules to every market at the same time. Simple scanners look for one condition, such as RSI below 30 or price above the 200-day average. More advanced scanners combine many conditions into a score.
The Alice scanner gives each market a score from 0 to 100 on the timeframe you choose, combining:
- Trend: price against the 9, 21, 50 and 200 moving averages and their order
- Momentum: RSI, MACD and the stochastic oscillator
- Volume: activity compared with normal and the buying versus selling pressure
- Structure: higher highs and lows, or lower highs and lows
- Breakouts: fresh breaks of support or resistance
- Higher timeframe: whether the bigger picture agrees
Scores of 65 and above lean bullish, 35 and below bearish, and the middle is neutral or ranging.
Step 1: choose your timeframe
Pick the timeframe that matches how long you hold trades:
- Scalping and fast day trading: 5 to 15 minutes
- Day trading: 1 hour
- Swing trading: 4 hours and daily
A 1-hour score of 85 means the conditions on the 1-hour chart are strongly bullish. It says little about the 5-minute chart or the weekly trend.
Step 2: shortlist the extremes
Sort by score and look at the top and the bottom of the list. Those are the markets where the most conditions line up in one direction. Ignore the middle unless you trade ranges.
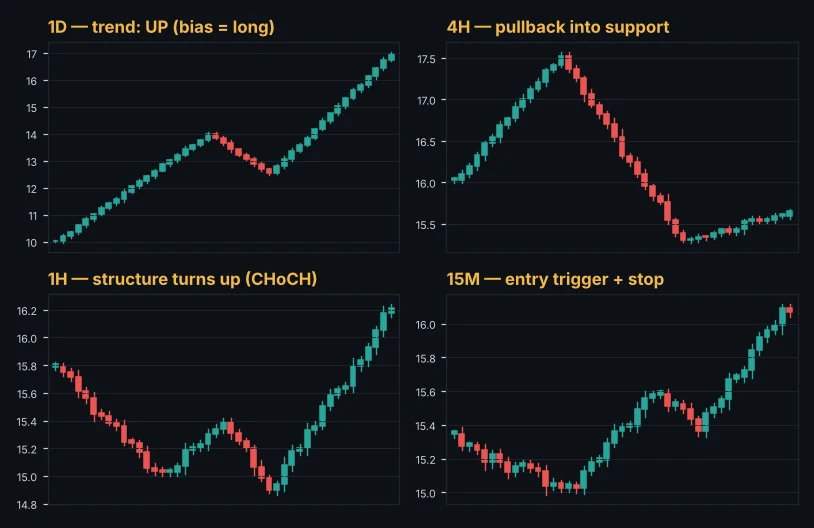
Check the higher timeframe too. A market scoring 80 on the 1-hour and 70 on the 4-hour has trend alignment; a market scoring 80 on the 1-hour but 25 on the daily is probably just a bounce in a downtrend.
Step 3: open the chart and find the trade
A high score tells you where to look, not when to enter. Open the market and check:
- Is price extended? A score of 95 with RSI above 85 after a vertical move is often a poor place to buy. Wait for a pullback.
- Where are the levels? The nearest support and resistance zones show where to place a stop and how much room there is to the target.
- Is there a clear entry? A pullback into support, a break and retest, or a candlestick signal at a level.
Step 4: plan the risk before you click
Write down the entry, stop and target, check the risk to reward, and calculate the position size from the stop.
Lots and units from your risk and stop loss. Free, no sign-up.
Open the position size calculatorStep 5: let the scanner watch for you
Instead of refreshing the scanner all day, set alerts: a breakout alert on a level you are watching, a trend-change alert when a market's score crosses 65 or 35, or a volume spike alert on a coin you follow. The server checks them continuously and notifies you.
Pitfalls to avoid
- Treating a high score as a buy signal. It means conditions line up, not that price must keep rising.
- Trading every market on the list. Many top crypto scores move together; that is one bet, not ten.
- Ignoring news. A perfect technical score can be erased by an unexpected central bank decision.
- Jumping between timeframes until something looks good. Pick your timeframe and stick to it.
Try it
You can try the scanner free in the web app, or see the strongest setups right now on the public live scanner page. Premium unlocks every timeframe and market; Elite adds every crypto pair and Best Trades, the highest-scoring setups across all markets with entry, stop and targets.
The Alice scanner scores every crypto, forex, gold and index market from 0 to 100 on every timeframe, so you can spot these setups in seconds.
Open the free web appFrequently asked questions
Can a scanner predict price?
No tool can. A scanner filters markets by current conditions so you spend your time on the ones most likely to offer a clear trade.
How often does the score update?
The Alice server rescans the markets every few minutes, so the score follows the market through the day.
Is a scanner useful for long-term investing?
Yes, on the daily and weekly timeframes it helps you spot assets in strong long-term trends or deep pullbacks within them.
This guide is for education only and is not financial advice. Trading involves a high risk of loss. Test any method on a demo account first and never risk money you cannot afford to lose.
Keep learning
 Strategy
Fibonacci Retracement Trading Guide: Levels, Golden Zone and Targets
How to draw Fibonacci retracements correctly, which levels matter (38.2%, 50%, 61.8%), how to use the golden zone for entries and extensions for targets, with examples.
 Strategy
RSI Indicator Explained: Settings, Divergence and How to Trade It
The Relative Strength Index made simple. How RSI is calculated, what overbought and oversold really mean, the best settings, divergence, and the mistakes that cost traders money.
 Strategy
Smart Money Concepts (SMC) for Beginners: Order Blocks, FVG and Liquidity
A clear introduction to smart money concepts. Market structure, BOS and CHoCH, order blocks, fair value gaps, liquidity sweeps and premium and discount zones, explained simply.