
In this guide
A setup that looks perfect on the 15-minute chart can be a tiny bounce inside a powerful daily downtrend. Top-down analysis solves this by reading the market from the biggest picture to the smallest: first the trend, then the setup, then the entry. It is the routine most professional traders follow every day.
The three roles of timeframes
| Role | Typical timeframe | Question it answers |
|---|---|---|
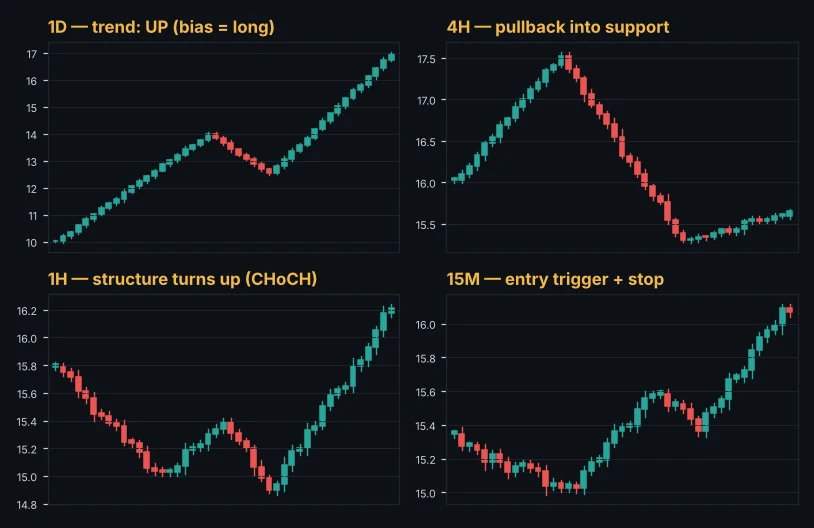
| Trend | Daily (or weekly) | Which direction should I trade? |
| Setup | 4-hour and 1-hour | Where is a good area to trade from? |
| Entry | 15-minute (or 5-minute) | When exactly do I get in, and where is my stop? |
A useful rule is to keep a ratio of about 4 to 6 between timeframes: daily, 4-hour, 1-hour, 15-minute.
Step 1: Read the trend on the daily chart
Mark the market structure: higher highs and higher lows for an uptrend, lower highs and lower lows for a downtrend. Note the 50 and 200-day moving averages and the major support and resistance zones. Write down your bias: long, short, or stay out.
Step 2: Find the setup on the 4-hour and 1-hour
In an uptrend, you want to buy pullbacks, not chase highs. Look for price coming back into:
- A support zone or a broken resistance (break and retest).
- The 50% to 61.8% Fibonacci retracement of the last swing.
- An order block or fair value gap.
- The 21 or 50 EMA.
When several of these line up in one area, that area is your setup zone.
Step 3: Time the entry on the 15-minute
Inside the setup zone, the lower timeframe will often still be falling. Wait for it to turn: a break of the last lower high (a change of character), followed by a higher low. Enter on that higher low, with the stop below it or below the zone.
Why this improves your trading
- Better direction: you only trade with the dominant trend.
- Smaller stops: the entry timeframe gives a precise stop, so the position can be larger for the same risk, or the risk smaller for the same size.
- Bigger targets: targets come from the higher timeframe, so a 15-minute entry can aim for a 4-hour level. That is how 1:3 and 1:5 trades happen.
Lots and units from your risk and stop loss. Free, no sign-up.
Open the position size calculatorCommon mistakes
- Too many timeframes. Three or four are enough. Looking at seven charts creates confusion.
- Letting the entry chart change your bias. If the 15-minute turns bearish but the daily is bullish, that is a pullback, not a reversal.
- Ignoring the session. A great setup at 3 a.m. on a quiet market can drift for hours. Time entries for active sessions.
Live sessions and overlaps in your time zone. Free, no sign-up.
Open the forex market hoursMulti-timeframe at a glance with Alice
Alice's multi-timeframe matrix shows the score for the 15M, 1H, 4H and 1D side by side for any market, so you can see in one second whether the timeframes agree. The scanner also marks when the 4-hour trend agrees with a 1-hour setup.
The Alice scanner scores every crypto, forex, gold and index market from 0 to 100 on every timeframe, so you can spot these setups in seconds.
Open the free web appFrequently asked questions
Which timeframes should a day trader use?
A common set is the 4-hour for trend, the 1-hour for setups and the 5- or 15-minute for entries.
Which timeframes should a swing trader use?
Weekly or daily for trend, daily and 4-hour for setups, and the 1-hour for entries.
What if the timeframes disagree?
Then the market is in transition. The safest choice is to wait until the setup timeframe aligns with the trend timeframe.
This guide is for education only and is not financial advice. Trading involves a high risk of loss. Test any method on a demo account first and never risk money you cannot afford to lose.
Keep learning
 Strategy
Fibonacci Retracement Trading Guide: Levels, Golden Zone and Targets
How to draw Fibonacci retracements correctly, which levels matter (38.2%, 50%, 61.8%), how to use the golden zone for entries and extensions for targets, with examples.
 Strategy
How to Use a Market Scanner to Find Better Trades Faster
A practical guide to market scanners for crypto, forex and gold. What a scanner score means, how to filter by timeframe, how to go from a scan to a planned trade, and the pitfalls to avoid.
 Strategy
RSI Indicator Explained: Settings, Divergence and How to Trade It
The Relative Strength Index made simple. How RSI is calculated, what overbought and oversold really mean, the best settings, divergence, and the mistakes that cost traders money.