
In this guide
If you strip technical analysis down to one idea, it is this: price remembers. Levels where buyers or sellers stepped in before tend to matter again. Support and resistance are the map every other tool is drawn on, and learning to draw them well improves every strategy you trade.
What support and resistance are
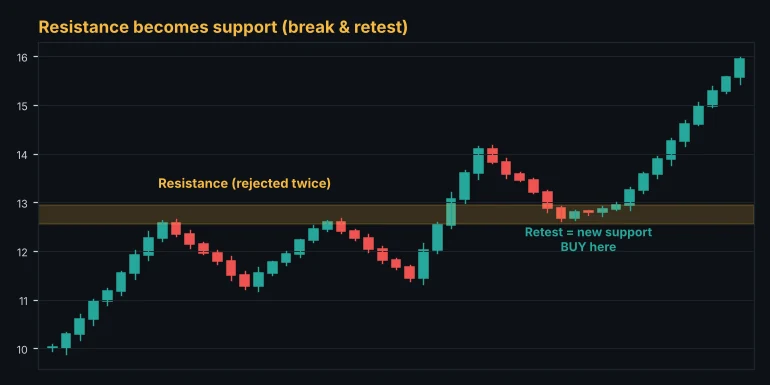
Support is a price area where buying has been strong enough to stop a fall. Resistance is an area where selling has been strong enough to stop a rise.
They work because of people and orders. Traders who missed a move place buy orders where price last bounced. Traders who bought near a top and sat through a loss sell when price gets back to their entry. Stop losses and pending orders cluster around obvious levels. All of that creates real supply and demand at those prices.
Zones, not lines
Price rarely turns at exactly the same tick. Draw support and resistance as zones, a band covering the bodies and wicks where the reaction happened. A zone of 10 to 20 pips on EUR/USD or a few dollars on gold is normal on the 4-hour chart. On the daily chart zones are wider.
Thinking in zones stops two common mistakes: placing your stop loss right on the line where everyone else's is, and calling a level "broken" when price only poked a few pips through it.
How to find the levels that matter
- Start on a higher timeframe. Daily and 4-hour levels carry more weight than 5-minute ones. Mark them first, then zoom in.
- Look for clear turning points. Swing highs and swing lows where price reversed sharply are your best candidates.
- Count the touches, but not too many. Two or three clean reactions confirm a zone. A zone hit eight times is getting weaker, because each touch uses up orders sitting there.
- Prefer levels with a strong move away. A level that launched a big rally shows real demand.
- Add round numbers. Prices like 1.1000, 2,500 or 100,000 attract orders.
- Keep the chart clean. If your chart has twenty lines, none of them mean anything. Keep the three or four nearest to price.
Role reversal: old resistance becomes new support
When price breaks above resistance and holds, that zone often becomes support. Traders who sold there are now losing and buy back on the retest, and traders who missed the breakout buy the pullback. The same works in reverse for broken support. This break and retest is one of the most reliable patterns in trading.
Two ways to trade the levels
The bounce
In a range or at a strong higher-timeframe level, trade the reaction:
- Wait for price to reach the zone.
- Look for confirmation: a rejection wick, a bullish or bearish engulfing candle, or a break of a small trend line on a lower timeframe.
- Place the stop beyond the zone, not inside it.
- Target the opposite side of the range or the next level.
The breakout and retest
When price is pressing against a level repeatedly, with higher lows under resistance for example, a breakout becomes more likely:
- Wait for a strong close through the zone, ideally with higher volume.
- Let price come back to retest the zone from the other side.
- Enter on the retest with a stop on the far side of the zone.
Entering on the retest instead of the first breakout candle avoids many false breakouts and gives a much better risk to reward.
Risk, reward, ratio and break-even win rate. Free, no sign-up.
Open the risk reward calculatorHelpful extra tools
- Pivot points give objective daily and weekly levels that many day traders watch.
- Fibonacci retracements show where a pullback may end inside a trend, and work best when they line up with a support or resistance zone.
- Moving averages such as the 50 and 200 often act as dynamic support and resistance.
When several of these line up in the same area, that area deserves extra attention.
How Alice finds the zones for you
For every market and timeframe, the Alice scanner detects support and resistance zones from swing points, measures how many times each one was touched and how strong it is, and tells you how far price is from the nearest zones. It also flags fresh breakouts and breakdowns, and you can set a breakout alert so the server watches the level for you.
The Alice scanner scores every crypto, forex, gold and index market from 0 to 100 on every timeframe, so you can spot these setups in seconds.
Open the free web appFrequently asked questions
How many touches make a strong level?
Two or three clear reactions usually confirm a zone. More touches can mean the level is weakening, because the orders that defended it are being used up.
Which timeframe is best for support and resistance?
The daily and 4-hour charts give the most important levels. Use lower timeframes to time entries around them.
What if price breaks a level and comes back?
That is a false breakout. It often leads to a strong move in the opposite direction, because traders who bought the breakout are trapped. Waiting for a retest helps you avoid many of them.
This guide is for education only and is not financial advice. Trading involves a high risk of loss. Test any method on a demo account first and never risk money you cannot afford to lose.
Keep learning
 Strategy
Fibonacci Retracement Trading Guide: Levels, Golden Zone and Targets
How to draw Fibonacci retracements correctly, which levels matter (38.2%, 50%, 61.8%), how to use the golden zone for entries and extensions for targets, with examples.
 Strategy
How to Use a Market Scanner to Find Better Trades Faster
A practical guide to market scanners for crypto, forex and gold. What a scanner score means, how to filter by timeframe, how to go from a scan to a planned trade, and the pitfalls to avoid.
 Strategy
RSI Indicator Explained: Settings, Divergence and How to Trade It
The Relative Strength Index made simple. How RSI is calculated, what overbought and oversold really mean, the best settings, divergence, and the mistakes that cost traders money.