
In this guide
Price tells you where the market is. Momentum tells you how hard it is pushing. When the two disagree, you have a divergence, and it is one of the earliest warnings that a trend is getting tired. The Relative Strength Index (RSI) is the most popular tool for spotting it.
Regular divergence: the reversal warning
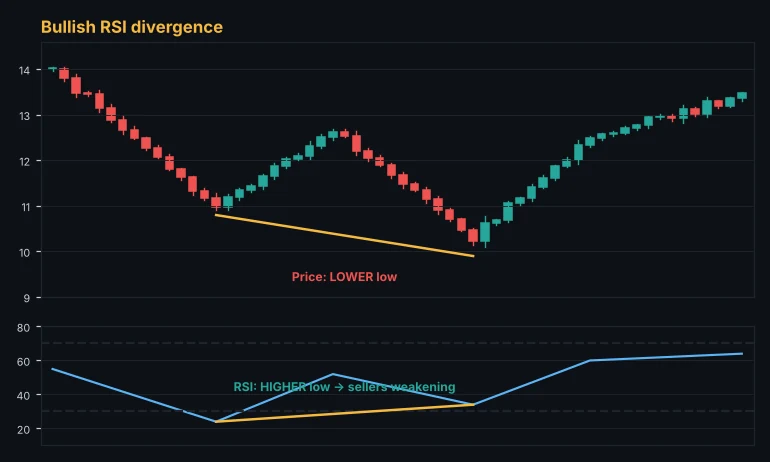
Bullish divergence
Price makes a lower low, but RSI makes a higher low. The market fell further, yet the selling pressure behind the move was weaker. It often appears near the end of a downtrend.
Bearish divergence
Price makes a higher high, but RSI makes a lower high. Buyers pushed to a new high with less force than before. It often appears near the end of an uptrend.
Hidden divergence: the continuation signal
Hidden divergence points the other way. It shows a trend that is pausing, not ending.
- Hidden bullish: price makes a higher low while RSI makes a lower low. In an uptrend, this pullback is a buying opportunity.
- Hidden bearish: price makes a lower high while RSI makes a higher high. In a downtrend, it is a selling opportunity.
How to find divergence correctly
- Compare swing points, not random candles. Connect two clear swing lows (or highs) on price and the matching points on RSI.
- Use closes for RSI. RSI is calculated from closing prices, so compare it with candle closes or clear wicks consistently.
- Keep it recent. Divergence between two swings that are 100 candles apart is not meaningful. Five to forty candles is typical.
- Prefer extreme zones. Bullish divergence with the first low below 30, or bearish divergence with the first high above 70, is more significant.
Divergence is a warning, not an entry
The biggest mistake is selling the moment you see bearish divergence. Strong trends can show divergence several times before they turn. Wait for the price to confirm:
- A break of structure: for bullish divergence, a break above the last lower high.
- A key level: divergence at a daily support or resistance zone carries more weight.
- A candlestick signal: an engulfing candle or a pin bar at the second swing.
A simple plan
- Entry: after the confirmation candle closes.
- Stop: beyond the second swing (below the lower low for bullish divergence).
- Targets: the previous swing high for the first target, then a 2R or 3R target.
Risk, reward, ratio and break-even win rate. Free, no sign-up.
Open the risk reward calculatorDivergence on different markets
- Forex: works well on the 1-hour to daily charts, especially at session highs and lows.
- Gold: divergence at round numbers like 2,600 or 2,700 is worth watching closely.
- Crypto: strong trends can stay "overbought" for a long time. Combine divergence with funding rates and open interest for better timing.
Let the scanner check momentum for you
In Alice, every market shows RSI, MACD and stochastic on every timeframe, and the score breakdown shows when momentum disagrees with the trend. The multi-timeframe matrix lets you see whether a 15-minute divergence is fighting the 4-hour trend.
The Alice scanner scores every crypto, forex, gold and index market from 0 to 100 on every timeframe, so you can spot these setups in seconds.
Open the free web appFrequently asked questions
Which RSI settings are best for divergence?
The standard 14-period RSI works for most traders. Shorter settings produce more signals but more noise.
Can divergence fail?
Yes, often. In a strong trend, momentum can stay weak while price keeps going. That is why you wait for a break of structure and always use a stop loss.
Is MACD divergence better than RSI divergence?
They measure momentum in slightly different ways. When both show divergence at the same time, the signal is stronger.
This guide is for education only and is not financial advice. Trading involves a high risk of loss. Test any method on a demo account first and never risk money you cannot afford to lose.
Keep learning
 Strategy
Fibonacci Retracement Trading Guide: Levels, Golden Zone and Targets
How to draw Fibonacci retracements correctly, which levels matter (38.2%, 50%, 61.8%), how to use the golden zone for entries and extensions for targets, with examples.
 Strategy
How to Use a Market Scanner to Find Better Trades Faster
A practical guide to market scanners for crypto, forex and gold. What a scanner score means, how to filter by timeframe, how to go from a scan to a planned trade, and the pitfalls to avoid.
 Strategy
RSI Indicator Explained: Settings, Divergence and How to Trade It
The Relative Strength Index made simple. How RSI is calculated, what overbought and oversold really mean, the best settings, divergence, and the mistakes that cost traders money.