
In this guide
The MACD (Moving Average Convergence Divergence) combines trend and momentum in one indicator. It shows whether a move is gaining or losing strength, which makes it useful for confirming trends and spotting turning points.
How MACD is built
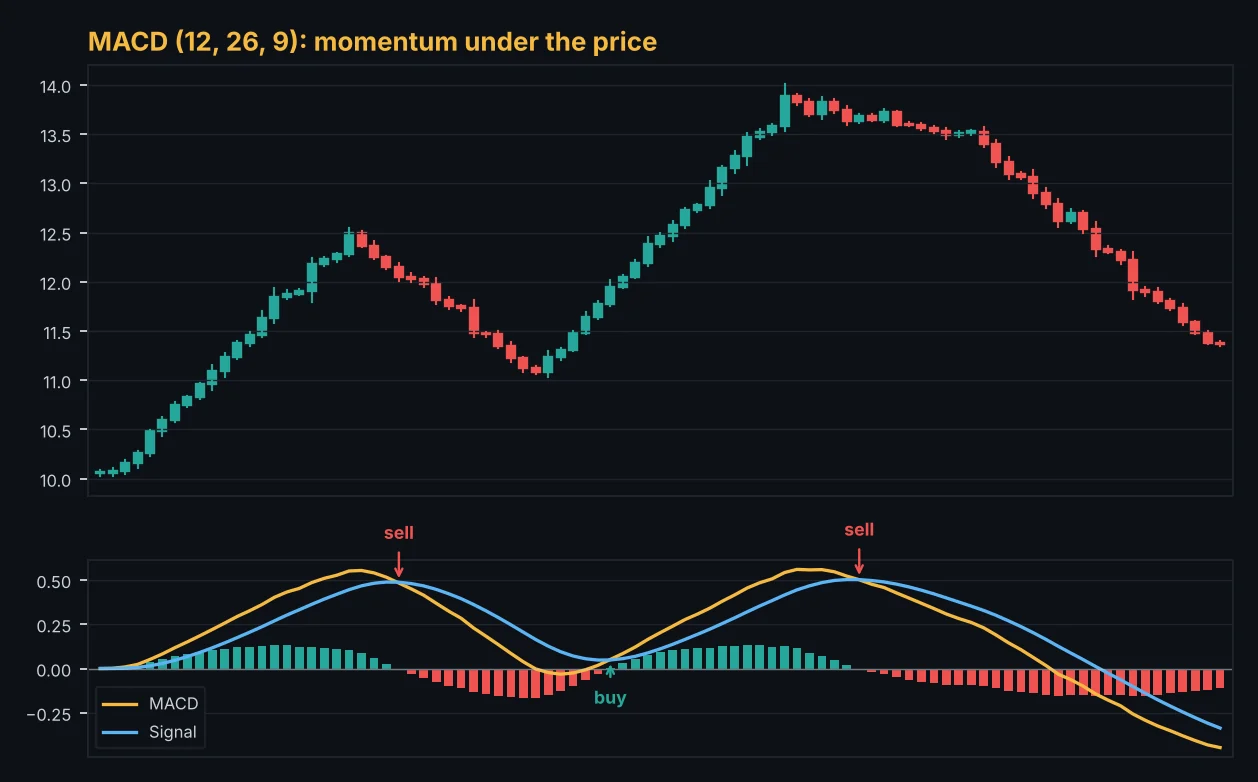
With the standard settings 12, 26 and 9:
- MACD line = 12-period EMA − 26-period EMA.
- Signal line = 9-period EMA of the MACD line.
- Histogram = MACD line − signal line.
When the fast average pulls away from the slow one, the MACD line moves away from zero. When they converge, it moves back toward zero.
Reading the three parts
- Above zero: the short-term average is above the long-term average. Momentum favours buyers.
- Below zero: sellers have the edge.
- Histogram growing: momentum is accelerating.
- Histogram shrinking: momentum is fading, often before price turns.
Strategy 1: Signal line crossover
A bullish signal comes when the MACD line crosses above the signal line; a bearish signal when it crosses below. On their own these crossovers are frequent and noisy. They work best:
- In the direction of the higher-timeframe trend.
- When the bullish crossover happens below zero (in a pullback) inside an uptrend.
Strategy 2: Zero-line cross
When the MACD line crosses above zero, the 12 EMA has crossed above the 26 EMA. It is a slower but more reliable trend signal, useful for confirming that a new trend has started.
Strategy 3: MACD divergence
If price makes a higher high but the MACD makes a lower high, upward momentum is fading. If price makes a lower low and the MACD a higher low, selling is weakening. Treat divergence as a warning, and wait for a break of structure before entering.
Risk, reward, ratio and break-even win rate. Free, no sign-up.
Open the risk reward calculatorSettings for different styles
- Standard (12, 26, 9): works on most timeframes.
- Faster (8, 17, 9): reacts quicker, for short-term trading, with more false signals.
- Slower (19, 39, 9): fewer, smoother signals for swing traders.
Limitations
MACD is based on moving averages, so it lags. In tight ranges it produces many whipsaws. Combine it with support and resistance and the higher-timeframe trend rather than trading every crossover.
MACD in Alice
Alice shows the MACD histogram for every market and timeframe, and momentum is one of the six parts of the scanner score. When the score breakdown shows strong trend but weakening momentum, that is often the MACD histogram shrinking ahead of a pullback.
The Alice scanner scores every crypto, forex, gold and index market from 0 to 100 on every timeframe, so you can spot these setups in seconds.
Open the free web appFrequently asked questions
Is MACD better than RSI?
They answer different questions. RSI shows overbought and oversold conditions, while MACD shows the strength and direction of momentum. Many traders use both.
What timeframe is best for MACD?
It works on all timeframes, but signals on the 1-hour, 4-hour and daily charts are more reliable than on very short charts.
Should I change the default settings?
Only if you have tested the change. The defaults are what most traders watch, which helps.
This guide is for education only and is not financial advice. Trading involves a high risk of loss. Test any method on a demo account first and never risk money you cannot afford to lose.
Keep learning
 Strategy
Fibonacci Retracement Trading Guide: Levels, Golden Zone and Targets
How to draw Fibonacci retracements correctly, which levels matter (38.2%, 50%, 61.8%), how to use the golden zone for entries and extensions for targets, with examples.
 Strategy
How to Use a Market Scanner to Find Better Trades Faster
A practical guide to market scanners for crypto, forex and gold. What a scanner score means, how to filter by timeframe, how to go from a scan to a planned trade, and the pitfalls to avoid.
 Strategy
RSI Indicator Explained: Settings, Divergence and How to Trade It
The Relative Strength Index made simple. How RSI is calculated, what overbought and oversold really mean, the best settings, divergence, and the mistakes that cost traders money.