
In this guide
The head and shoulders is one of the most reliable reversal patterns in technical analysis. It appears at the end of an uptrend and warns that buyers are running out of strength. Its mirror image, the inverse head and shoulders, appears at the end of a downtrend. Because the pattern has a clear structure, it gives you everything a trade plan needs: an entry, a stop loss and a measured target.
What the pattern looks like
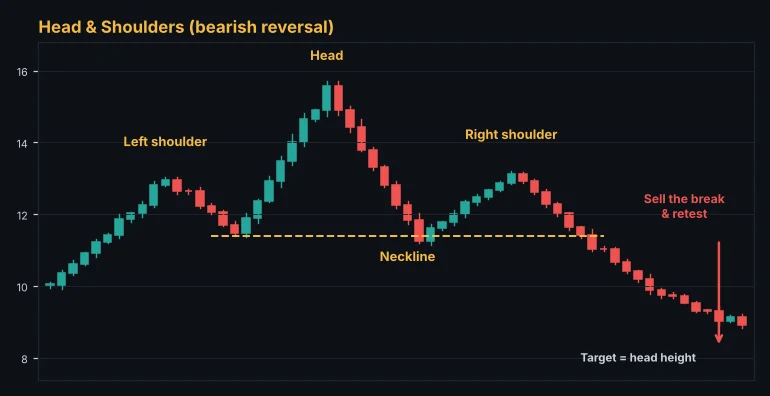
A classic head and shoulders top has three peaks:
- Left shoulder: price makes a high in an uptrend, then pulls back.
- Head: buyers push price to a higher high, then it falls back to roughly the same area as the first pullback.
- Right shoulder: buyers try again but fail to reach the head. The peak is lower.
Connect the two pullback lows and you have the neckline. As long as price stays above it, the uptrend is technically intact. A clear close below the neckline completes the pattern.
Why it works
The pattern is a picture of a trend losing momentum. The head is the last strong push from buyers. The right shoulder shows that the next push could not even reach the old high, so sellers are now in control of the swings. When the neckline breaks, traders who bought the right shoulder are trapped and their stop losses add fuel to the move down.
How to trade a head and shoulders top
Entry
There are two common entries:
- Breakout entry: sell when a candle closes below the neckline. You catch the move early but face more false breaks.
- Retest entry: wait for price to return to the broken neckline from below and reject it. You miss some trades, but the ones you take have a better risk to reward.
Stop loss
Place the stop above the right shoulder. A tighter stop just above the retest high is possible on the retest entry, but give the trade room for normal volatility. The average true range (ATR) of the timeframe is a good guide.
Target
Measure the distance from the top of the head down to the neckline. Project that distance down from the breakout point. That is the measured move target. Many traders take half the position off at the first support zone and let the rest run to the measured target.
Risk, reward, ratio and break-even win rate. Free, no sign-up.
Open the risk reward calculatorThe inverse head and shoulders
Flip everything upside down and you get a bullish reversal at the end of a downtrend: a low, a lower low (the head), then a higher low (the right shoulder). Buy the break above the neckline or the retest, stop below the right shoulder, and project the head-to-neckline distance upward.
Filters that improve the pattern
- Volume: in a healthy top, volume often fades on the head and right shoulder, then expands on the neckline break.
- Higher timeframe: a head and shoulders on the 4-hour chart that forms at a daily resistance zone is far more powerful than one in the middle of nowhere.
- Momentum divergence: RSI making a lower high while price makes the head is extra evidence that the trend is tiring.
- A sloping neckline: a neckline that slopes down (for a top) shows sellers are already stronger, which is a good sign.
Common mistakes
- Trading it before it completes. Three peaks are not a pattern until the neckline breaks.
- Seeing it everywhere. The pattern should follow a clear trend. Without a prior uptrend there is nothing to reverse.
- Stops that are too tight. Necklines are retested often. A stop a few pips above the neckline will be hit by normal noise.
- Ignoring position size. Size the trade from the distance to your stop so that a loss costs a fixed percentage of your account.
Lots and units from your risk and stop loss. Free, no sign-up.
Open the position size calculatorSpot reversals faster with Alice
The Alice scanner flags breakdowns, momentum divergence and trend changes on every timeframe, and its support and resistance zones show where a neckline lines up with a major level. Set a breakdown alert on the neckline and let the server watch it for you.
The Alice scanner scores every crypto, forex, gold and index market from 0 to 100 on every timeframe, so you can spot these setups in seconds.
Open the free web appFrequently asked questions
Is the head and shoulders pattern reliable?
It is one of the more reliable reversal patterns, but no pattern works every time. Its strength comes from the clear stop and target, which let you keep losses small when it fails.
What timeframe is best?
The 4-hour and daily charts give the most meaningful patterns. On very low timeframes the shape appears constantly and fails more often.
How long should the pattern take to form?
There is no fixed rule, but the shoulders should be roughly balanced in time and height. A pattern that is very lopsided is less trustworthy.
What if price breaks the neckline and comes back above it?
That is a failed pattern, and failed patterns can produce strong moves in the opposite direction. Exit if price closes back above the right shoulder and look for the reversal.
This guide is for education only and is not financial advice. Trading involves a high risk of loss. Test any method on a demo account first and never risk money you cannot afford to lose.
Keep learning
 Strategy
Fibonacci Retracement Trading Guide: Levels, Golden Zone and Targets
How to draw Fibonacci retracements correctly, which levels matter (38.2%, 50%, 61.8%), how to use the golden zone for entries and extensions for targets, with examples.
 Strategy
How to Use a Market Scanner to Find Better Trades Faster
A practical guide to market scanners for crypto, forex and gold. What a scanner score means, how to filter by timeframe, how to go from a scan to a planned trade, and the pitfalls to avoid.
 Strategy
RSI Indicator Explained: Settings, Divergence and How to Trade It
The Relative Strength Index made simple. How RSI is calculated, what overbought and oversold really mean, the best settings, divergence, and the mistakes that cost traders money.