
In this guide
Double tops and double bottoms are the simplest reversal patterns you can learn, and they appear on every market and timeframe. Traders often call them the M and W patterns because of their shape. When they form at a key level and break correctly, they mark the point where a trend runs out of steam.
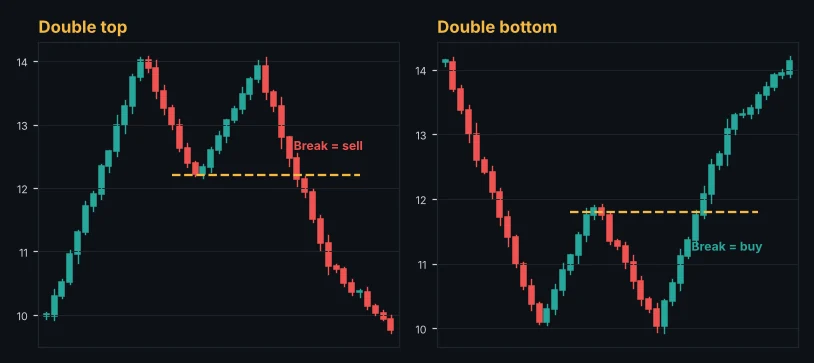
The double top (bearish)
- Price rallies to a high and pulls back.
- It rallies again to roughly the same high, but cannot break it.
- It falls back through the low between the two peaks. That low is the neckline.
The second failure at the same price tells you sellers are defending that area. The neckline break confirms that buyers have given up.
The double bottom (bullish)
The same idea upside down: two lows at about the same level, a bounce between them, and a break above the bounce high. It often appears after a long fall, when sellers can no longer push price lower.
How to trade the pattern
Wait for confirmation
Two equal highs alone are just resistance. Many uptrends pause at a level, pull back, and then break higher. The pattern only exists once the neckline breaks with a solid candle close.
Entry options
- On the break: enter when a candle closes through the neckline.
- On the retest: wait for price to come back to the neckline and reject it. This gives a tighter stop and a better ratio.
Stop loss
For a double top, the stop goes above the two highs. For a double bottom, below the two lows. If that distance is too large for your account, reduce your position size rather than moving the stop closer.
Target
Measure the height from the peaks (or troughs) to the neckline and project it from the breakout. Look for a support or resistance zone near that target, and use Fibonacci extensions to fine-tune it.
Retracement and extension levels from a swing. Free, no sign-up.
Open the fibonacci calculatorHow to tell a real double top from a pause
- Location: the best patterns form at a higher-timeframe level, a round number or a previous swing high.
- Momentum: RSI or MACD making a lower second peak (bearish divergence) adds weight to the signal.
- Volume: lower volume on the second peak shows weaker participation.
- Time between peaks: peaks that are too close together are usually just noise. A few weeks on the daily or a day or two on the hourly chart is typical.
Triple tops and bottoms
Sometimes price tests the level a third time before breaking. The logic is the same: wait for the neckline break and measure the move. A third test that fails is often even stronger evidence.
Mistakes to avoid
- Shorting the second peak before the neckline breaks.
- Ignoring the bigger trend. A double bottom in a strong daily downtrend is more likely to be a pause than a reversal.
- Using a fixed target without checking for support or resistance on the way.
Risk, reward, ratio and break-even win rate. Free, no sign-up.
Open the risk reward calculatorLet Alice watch the neckline
In Alice, open any market and look at the support and resistance zones: equal highs and lows are marked as liquidity, and the scanner flags fresh breakouts and breakdowns. Set an alert on the neckline and you will be notified on your phone or computer when it breaks.
The Alice scanner scores every crypto, forex, gold and index market from 0 to 100 on every timeframe, so you can spot these setups in seconds.
Open the free web appFrequently asked questions
Do the two peaks need to be exactly equal?
No. Within a small range, such as one ATR, is fine. In fact, a slightly lower second peak in a double top often shows weaker buyers.
Which is more reliable, a double top or a head and shoulders?
Both are reliable when they form at strong levels and break with momentum. The head and shoulders gives more information about weakening momentum, while the double top is easier to spot.
Can I trade these patterns in crypto?
Yes. They work on crypto, forex, gold and indices. In crypto, check that volume confirms the break, because thin markets produce more false breakouts.
This guide is for education only and is not financial advice. Trading involves a high risk of loss. Test any method on a demo account first and never risk money you cannot afford to lose.
Keep learning
 Strategy
Fibonacci Retracement Trading Guide: Levels, Golden Zone and Targets
How to draw Fibonacci retracements correctly, which levels matter (38.2%, 50%, 61.8%), how to use the golden zone for entries and extensions for targets, with examples.
 Strategy
How to Use a Market Scanner to Find Better Trades Faster
A practical guide to market scanners for crypto, forex and gold. What a scanner score means, how to filter by timeframe, how to go from a scan to a planned trade, and the pitfalls to avoid.
 Strategy
RSI Indicator Explained: Settings, Divergence and How to Trade It
The Relative Strength Index made simple. How RSI is calculated, what overbought and oversold really mean, the best settings, divergence, and the mistakes that cost traders money.