
In this guide
Trends rarely move in a straight line. After a strong push, price usually pauses while early traders take profit and new traders wait for a better price. These pauses often take recognisable shapes called continuation patterns. When the pause ends, the trend frequently continues with a move about as large as the one before it.
Bull flags and bear flags
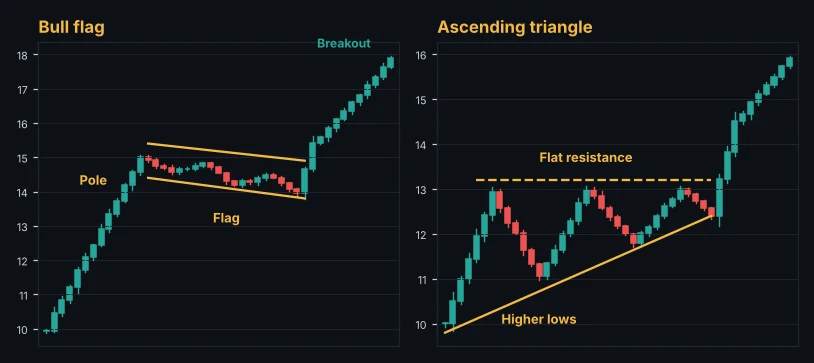
A bull flag has two parts:
- The pole: a fast, strong rally, usually on rising volume.
- The flag: a small, orderly pullback that drifts slightly down or sideways in a narrow channel, usually on falling volume.
The flag shows that sellers cannot do much damage. When price breaks above the top of the flag, buyers are back in control. A bear flag is the same shape upside down in a downtrend.
Trading a flag
- Entry: a close above the flag's upper line (or below the lower line for a bear flag).
- Stop: below the flag's low.
- Target: add the height of the pole to the breakout point.
The best flags are short. If the pullback retraces more than about half of the pole, it is no longer a flag but a deeper correction.
Pennants
A pennant is a flag that narrows into a small symmetrical triangle instead of a channel. It is traded the same way: enter on the breakout in the trend's direction, stop beyond the pennant, target equal to the pole.
Triangles
Ascending triangle
Flat resistance on top and higher lows underneath. Buyers keep stepping in earlier, squeezing sellers against the same ceiling. A break above the flat top is a bullish signal. Target: the height of the triangle's widest part added to the breakout.
Descending triangle
Flat support with lower highs above it. Sellers are getting more aggressive. A break below the flat support is bearish.
Symmetrical triangle
Lower highs and higher lows converge. It shows indecision, and it usually breaks in the direction of the existing trend. Because both sides are active, wait for the breakout candle to close before you act.
Rules that filter out bad breakouts
- Trade with the trend. Continuation patterns are strongest when they point in the direction of the higher-timeframe trend.
- Look for volume. A real breakout usually comes with a volume surge. A breakout on thin volume is suspicious.
- Wait for the close. Intrabar spikes through a line often reverse before the candle ends.
- Respect the retest. Many breakouts come back to test the broken line. That retest is a second, lower-risk entry.
- Mind the news. A breakout minutes before a major release such as CPI or NFP can reverse violently.
Risk, reward, ratio and break-even win rate. Free, no sign-up.
Open the risk reward calculatorWhere traders go wrong
- Drawing a "triangle" from only two touches. You want at least two touches on each line.
- Entering in the middle of the pattern, where the risk to reward is poor.
- Placing stops inside the pattern, where normal noise will hit them.
- Using the same size for every trade instead of sizing from the stop distance.
Lots and units from your risk and stop loss. Free, no sign-up.
Open the position size calculatorFind breakouts with Alice
The Alice scanner tags fresh breakouts and breakdowns, volume spikes and trend agreement with the higher timeframe on every market. Filter the scanner by "Breakout" to see which flags and triangles are resolving right now, then open the chart to check the pattern.
The Alice scanner scores every crypto, forex, gold and index market from 0 to 100 on every timeframe, so you can spot these setups in seconds.
Open the free web appFrequently asked questions
What is the success rate of a bull flag?
It depends on the market and the filters you use. Flags that form in a strong trend, with a short pullback and a high-volume breakout, perform much better than average. Always plan for the trades that fail.
How do I know which way a symmetrical triangle will break?
You do not know in advance. It breaks with the prior trend more often than not, but the safest approach is to wait for a confirmed close outside the pattern.
Can I use these patterns for scalping?
Yes, flags and pennants appear on 5- and 15-minute charts too. They are less reliable there, so tighten your filters: trade only in the direction of the 1-hour trend and during active sessions.
This guide is for education only and is not financial advice. Trading involves a high risk of loss. Test any method on a demo account first and never risk money you cannot afford to lose.
Keep learning
 Strategy
Fibonacci Retracement Trading Guide: Levels, Golden Zone and Targets
How to draw Fibonacci retracements correctly, which levels matter (38.2%, 50%, 61.8%), how to use the golden zone for entries and extensions for targets, with examples.
 Strategy
How to Use a Market Scanner to Find Better Trades Faster
A practical guide to market scanners for crypto, forex and gold. What a scanner score means, how to filter by timeframe, how to go from a scan to a planned trade, and the pitfalls to avoid.
 Strategy
RSI Indicator Explained: Settings, Divergence and How to Trade It
The Relative Strength Index made simple. How RSI is calculated, what overbought and oversold really mean, the best settings, divergence, and the mistakes that cost traders money.