
In this guide
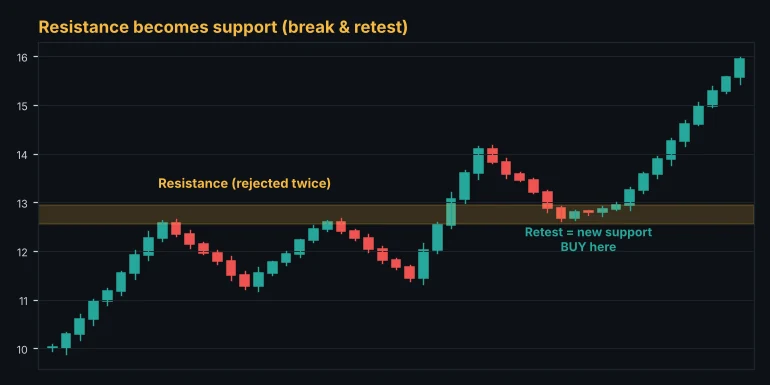
Breakouts are exciting, but buying the moment price pokes through a level is one of the fastest ways to get trapped. The break and retest strategy waits for proof. After a level breaks, price often comes back to test it from the other side. If the old resistance now holds as support, you have a high-quality entry with a small, logical stop.
Why levels flip
A resistance level is an area where sellers have been active. When price finally breaks above it, two things happen:
- Traders who sold at resistance are now losing and want to buy back near their entry to get out.
- Traders who missed the breakout want a second chance to buy.
When price returns to the level, both groups buy. That demand turns old resistance into new support. The same logic works in reverse for broken support.
The three steps
1. A clean break
Look for a strong candle that closes clearly beyond a well-tested level, ideally with above-average volume. A wick through the level is not a break.
2. The retest
Price pulls back to the broken level. It does not need to touch it exactly. Treat the level as a zone a few pips or a fraction of a percent wide.
3. The rejection
Wait for evidence that the level holds: a pin bar, an engulfing candle, or a lower-timeframe break of structure in your direction. That is your trigger.
Trade plan
- Entry: after the rejection candle closes, or on a lower-timeframe trigger.
- Stop loss: on the other side of the zone, beyond the retest's wick.
- Target: the next major level. A 2R minimum makes the setup worthwhile.
Lots and units from your risk and stop loss. Free, no sign-up.
Open the position size calculatorWhen to skip the trade
- No retest at all. Some breakouts never come back. Let them go. There will be another setup.
- A deep retest. If price falls back well inside the old range and closes there, the breakout failed.
- Against the higher timeframe. A 15-minute break and retest against a strong 4-hour trend is a low-quality trade.
- Right before big news. Volatility around releases can blow through any level.
Combine it with other tools
- Moving averages: a retest that lines up with the 21 or 50 EMA is stronger.
- Fibonacci: retests often stop near the 38.2% or 50% retracement of the breakout move.
- Volume: falling volume on the pullback and rising volume on the bounce is the ideal picture.
Risk, reward, ratio and break-even win rate. Free, no sign-up.
Open the risk reward calculatorWatch breaks with Alice
Alice detects support and resistance zones on every timeframe and marks fresh breakouts and breakdowns in the scanner. Use the Breakout filter, open a market, and set an alert on the broken level so you are notified when price comes back to retest it.
The Alice scanner scores every crypto, forex, gold and index market from 0 to 100 on every timeframe, so you can spot these setups in seconds.
Open the free web appFrequently asked questions
How long does a retest usually take?
Anything from a few candles to several days, depending on the timeframe. On the 1-hour chart, many retests happen within one or two sessions.
Is the retest entry always better than the breakout entry?
It usually offers a better risk to reward and fewer false signals, but you will miss some strong moves that never pull back.
Does break and retest work in crypto?
Yes. It works on crypto, forex, gold and stock indices. In crypto, check that the breakout came with real volume, because thin order books produce more fake moves.
This guide is for education only and is not financial advice. Trading involves a high risk of loss. Test any method on a demo account first and never risk money you cannot afford to lose.
Keep learning
 Strategy
Fibonacci Retracement Trading Guide: Levels, Golden Zone and Targets
How to draw Fibonacci retracements correctly, which levels matter (38.2%, 50%, 61.8%), how to use the golden zone for entries and extensions for targets, with examples.
 Strategy
How to Use a Market Scanner to Find Better Trades Faster
A practical guide to market scanners for crypto, forex and gold. What a scanner score means, how to filter by timeframe, how to go from a scan to a planned trade, and the pitfalls to avoid.
 Strategy
RSI Indicator Explained: Settings, Divergence and How to Trade It
The Relative Strength Index made simple. How RSI is calculated, what overbought and oversold really mean, the best settings, divergence, and the mistakes that cost traders money.