
In this guide
Most traders know what they think they do. A trading journal shows what they actually do. It is the cheapest and most effective way to improve, because it turns vague feelings like "I always lose on Fridays" into facts you can act on.
Why a journal works
Memory is selective. We remember the big win and the painful loss, and forget the forty ordinary trades that really decide our results. A journal records every trade the same way, so after a few weeks you can see:
- which setups make money and which do not
- which markets and hours suit you
- whether you follow your own rules
- how emotions change your decisions
What to record for every trade
| Field | Example |
|---|---|
| Date and time | 14 Oct, 14:35 UTC |
| Market and direction | EUR/USD, long |
| Setup | Break and retest of 4H resistance |
| Entry, stop, target | 1.0852, 1.0828, 1.0900 |
| Risk | 1% ($50) |
| Result | +$98, or +1.96R |
| Followed the plan? | Yes / no, and why |
| Emotion | Calm, rushed, frustrated |
| Screenshot | Chart at entry and at exit |
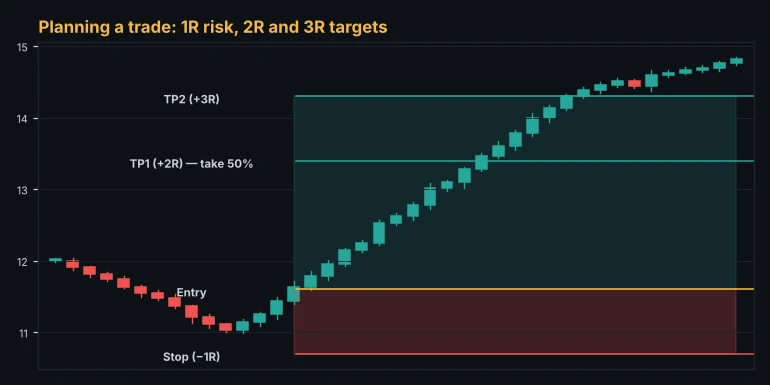
The R multiple is the most useful number: the result divided by the amount you risked. A win of $98 on a $50 risk is +1.96R. A full loss is −1R. R lets you compare trades of different sizes and markets.
The statistics that matter
After 30 to 50 trades, calculate:
- Win rate: winning trades divided by all trades.
- Average win and average loss, in R.
- Expectancy: the average result per trade.
Expectancy = Win rate × Average win − Loss rate × Average loss
A positive expectancy means your method makes money on average. If it is negative, no amount of discipline will fix it; the setup itself needs to change.
Break the statistics down by setup, market, day of the week and time of day. That is usually where the biggest insights are hiding.
Risk, reward, ratio and break-even win rate. Free, no sign-up.
Open the risk reward calculatorHow to review your journal
- Daily, two minutes: did I follow my rules today?
- Weekly, twenty minutes: look at all trades, update the statistics, write down one thing to keep and one thing to change.
- Monthly: compare setups and markets, cut what does not work, and focus on what does.
Be honest in the "followed the plan" column. A winning trade that broke your rules is a bad trade; a losing trade that followed them is a good one.
Common journaling mistakes
- Only recording losing trades, or only winning ones.
- Recording results without the setup, so you cannot learn which setups work.
- Collecting data and never reviewing it.
- Changing the method every week, so no setup ever has enough trades to judge.
A journal that does the maths for you
The Trading Journal in the Alice app records each trade with setup, entry, stop, target, result, emotion and notes, and calculates your win rate, average R, profit factor and net result automatically. Premium members can ask the AI to review their statistics and point out patterns. The Portfolio Tracker next to it follows the live value of your holdings.
The Alice scanner scores every crypto, forex, gold and index market from 0 to 100 on every timeframe, so you can spot these setups in seconds.
Open the free web appFrequently asked questions
How many trades do I need before the statistics mean anything?
At least 30, and ideally 50 to 100 trades of the same setup, before you draw firm conclusions.
Should I journal demo trades?
Yes. A demo journal is the best way to test a new setup before risking real money.
What is a good win rate?
It depends on your risk to reward. A 35% win rate is excellent with 1:3 trades, and a 60% win rate can still lose money with poor risk to reward.
This guide is for education only and is not financial advice. Trading involves a high risk of loss. Test any method on a demo account first and never risk money you cannot afford to lose.
Keep learning
 Trading basics
Candlestick Patterns Every Trader Should Know (and When They Fail)
How to read candlestick charts and the patterns that matter most: engulfing, pin bar, doji, inside bar, morning and evening star. Plus how to filter out false signals.
 Trading basics
Crypto vs Forex Trading: Which Market Is Better for You?
An honest comparison of crypto and forex trading. Trading hours, volatility, leverage, costs, regulation and what each market rewards, so you can choose the right one for your style.
 Trading basics
How to Calculate Position Size in Forex and Crypto (With Examples)
Learn the position sizing formula that professional traders use. Step-by-step examples for forex, gold and Bitcoin, plus the mistakes that blow up accounts.