
In this guide
Candlestick charts are the default view on almost every trading platform, and for good reason: each candle packs four prices and the battle between buyers and sellers into one shape. Learning to read them takes a few minutes. Learning which patterns are worth acting on takes longer, and context is the key.
How to read a candle
Every candle shows four prices for its period:
- Open: the first price
- High: the highest price reached
- Low: the lowest price reached
- Close: the last price
The thick part is the body, between open and close. It is usually green or white when the close is above the open (bullish) and red or black when it is below (bearish). The thin lines are the wicks or shadows, showing how far price travelled beyond the body.
Candlestick charting comes from Japanese rice traders, and was introduced to Western traders by Steve Nison in the early 1990s.
What a candle tells you
- A long body with small wicks shows conviction: one side was in control the whole time.
- A long wick shows rejection: price went there and was pushed back.
- A small body shows indecision.
The patterns that matter most
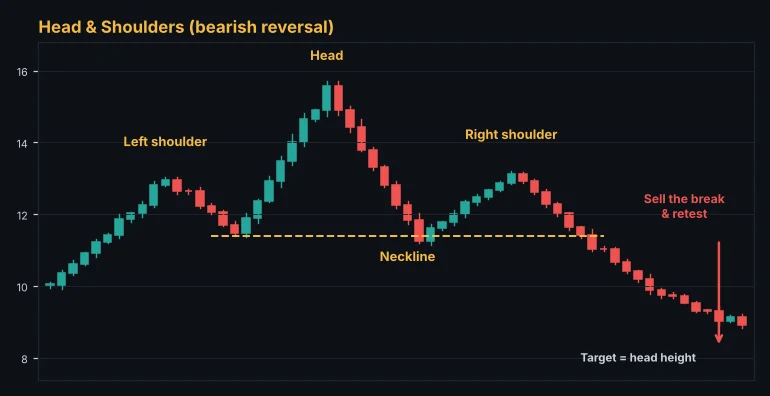
Engulfing
A bullish engulfing is a bearish candle followed by a bullish candle whose body completely covers the previous body. Sellers were in control, then buyers took over decisively. The bearish engulfing is the mirror image. At a support or resistance zone, it is one of the most reliable reversal signals.
Pin bar (hammer and shooting star)
A candle with a small body and a long wick on one side, at least two to three times the body. A hammer has a long lower wick and appears after a decline: price was pushed down and strongly rejected. A shooting star has a long upper wick after a rise. The wick shows where the market refused to go.
Doji
A candle where the open and close are nearly equal, so the body is a thin line. It shows indecision. A doji after a strong trend into a key level can be an early warning; in the middle of a range it means very little.
Inside bar
A candle whose high and low sit entirely within the previous candle's range. It shows a pause and contraction. Traders often trade the breakout of the inside bar in the direction of the trend.
Morning star and evening star
Three-candle reversal patterns. A morning star is a strong bearish candle, then a small indecisive candle, then a strong bullish candle closing well into the first candle's body. The evening star is the bearish version at a top.
Why patterns fail without context
A hammer in the middle of nowhere on a 5-minute chart is noise. The same hammer at a daily support zone, in an uptrend, at the 61.8% Fibonacci level, is a serious signal. Before trading a pattern, ask:
- Where is it? Patterns at key support, resistance or Fibonacci levels matter. Patterns in the middle of a range do not.
- Which way is the trend? Bullish patterns in an uptrend have higher odds than bullish patterns in a downtrend.
- What timeframe? Daily and 4-hour patterns carry more weight than 1-minute ones.
- Was it confirmed? Many traders wait for the next candle to break the pattern's high or low before entering.
Retracement and extension levels from a swing. Free, no sign-up.
Open the fibonacci calculatorTurning a pattern into a trade
A simple plan for a bullish engulfing at support:
- Entry: above the high of the engulfing candle, or on a small pullback into it
- Stop: below the low of the pattern, with a small buffer
- Target: the next resistance zone
- Check: the risk to reward is at least 1:1.5, and the size is calculated from the stop
Risk, reward, ratio and break-even win rate. Free, no sign-up.
Open the risk reward calculatorPatterns in the Alice scanner
When you open a market in Alice, the analysis lists recent candlestick patterns such as engulfings, pin bars and dojis, together with the support and resistance zones, the trend score and the higher-timeframe view, so you can see at once whether a pattern appears in a place that matters.
The Alice scanner scores every crypto, forex, gold and index market from 0 to 100 on every timeframe, so you can spot these setups in seconds.
Open the free web appFrequently asked questions
What is the most reliable candlestick pattern?
Engulfing patterns and pin bars at strong support or resistance in the direction of the higher-timeframe trend tend to be the most useful. No pattern is reliable on its own.
Do candlestick patterns work in crypto?
Yes, they work on any liquid market. On smaller coins, wicks can be caused by thin order books, so focus on the larger coins and higher timeframes.
Should I wait for the candle to close?
Yes. A pattern is not complete until the candle closes. A hammer can turn into a bearish candle in the last minute.
This guide is for education only and is not financial advice. Trading involves a high risk of loss. Test any method on a demo account first and never risk money you cannot afford to lose.
Keep learning
 Trading basics
Crypto vs Forex Trading: Which Market Is Better for You?
An honest comparison of crypto and forex trading. Trading hours, volatility, leverage, costs, regulation and what each market rewards, so you can choose the right one for your style.
 Trading basics
How to Calculate Position Size in Forex and Crypto (With Examples)
Learn the position sizing formula that professional traders use. Step-by-step examples for forex, gold and Bitcoin, plus the mistakes that blow up accounts.
 Trading basics
Leverage and Margin Explained: How They Work and How Not to Get Liquidated
What leverage and margin really are in forex and crypto, how margin calls and liquidation work, the leverage limits regulators set, and how to use leverage safely.