
In this guide
You can lose more trades than you win and still make money. You can also win most of your trades and lose money. The difference is the risk to reward ratio: how much you stand to gain compared with how much you risk on each trade.
The basic calculation
- Risk = the distance from your entry to your stop loss.
- Reward = the distance from your entry to your take profit.
- Ratio = reward ÷ risk.
Example: you buy gold at 2,650 with a stop at 2,640 and a target at 2,680. Risk is 10, reward is 30, so the ratio is 1:3.
Risk, reward, ratio and break-even win rate. Free, no sign-up.
Open the risk reward calculatorThinking in R
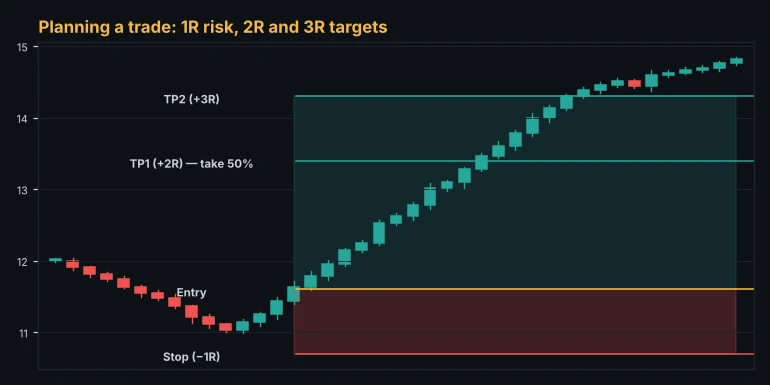
Professional traders measure trades in R, where 1R is the amount risked. A trade that hits a 1:3 target makes +3R. A stop loss is −1R. This makes results comparable no matter the market or position size.
Why the ratio and win rate belong together
The ratio alone means nothing without your win rate. The break-even win rate for any ratio is:
Break-even win rate = 1 ÷ (1 + ratio)
| Risk to reward | Break-even win rate |
|---|---|
| 1:1 | 50% |
| 1:1.5 | 40% |
| 1:2 | 33% |
| 1:3 | 25% |
With a 1:2 ratio you only need to win a third of your trades to break even. Anything above that is profit, before costs.
Expectancy: the number that really matters
Expectancy = (win rate × average win) − (loss rate × average loss)
Example: you win 45% of trades at +2R and lose 55% at −1R. Expectancy = 0.45 × 2 − 0.55 × 1 = +0.35R per trade. Over 100 trades, that is +35R. If you risk 1% per trade, that is roughly +35% before costs.
How to set realistic targets
A great ratio on paper is useless if the target is unrealistic. Place targets at real levels:
- The next support or resistance zone.
- A previous swing high or low.
- A Fibonacci extension, such as 1.272 or 1.618.
- A measured move from a chart pattern.
If the nearest realistic target gives less than about 1.5R, the trade is usually not worth taking.
Managing the trade in stages
Many traders split the position:
- Take half the position off at 2R.
- Move the stop to break-even.
- Let the rest run to 3R or trail it behind swing points.
This locks in profit while still giving the trade room to deliver a big winner.
Lots and units from your risk and stop loss. Free, no sign-up.
Open the position size calculatorCommon mistakes
- Moving the stop further away when price approaches it. That changes your ratio after the fact.
- Closing winners too early out of fear, which turns a 1:3 plan into a 1:0.8 result.
- Forgetting costs. Spreads and fees reduce your real reward, especially on short timeframes.
Plan trades with Alice
Alice's Best Trades show entry, stop loss and two targets for every setup, and the risk calculator pro turns your stop distance into position size, margin and liquidation price. The trading journal records the R of every trade so you can measure your real expectancy.
The Alice scanner scores every crypto, forex, gold and index market from 0 to 100 on every timeframe, so you can spot these setups in seconds.
Open the free web appFrequently asked questions
What is a good risk to reward ratio?
1:2 or better is a common rule of thumb, but the right ratio depends on your strategy's win rate. Trend-following systems often aim for 1:3, while scalpers may accept 1:1.5 with a higher win rate.
Should every trade have the same ratio?
No. Let the market decide: use real levels for targets and skip trades where the nearest target gives too little reward.
Does a high ratio mean a better strategy?
Not necessarily. A 1:5 target that is hit only 10% of the time loses money. Always look at ratio and win rate together.
This guide is for education only and is not financial advice. Trading involves a high risk of loss. Test any method on a demo account first and never risk money you cannot afford to lose.
Keep learning
 Trading basics
Candlestick Patterns Every Trader Should Know (and When They Fail)
How to read candlestick charts and the patterns that matter most: engulfing, pin bar, doji, inside bar, morning and evening star. Plus how to filter out false signals.
 Trading basics
Crypto vs Forex Trading: Which Market Is Better for You?
An honest comparison of crypto and forex trading. Trading hours, volatility, leverage, costs, regulation and what each market rewards, so you can choose the right one for your style.
 Trading basics
How to Calculate Position Size in Forex and Crypto (With Examples)
Learn the position sizing formula that professional traders use. Step-by-step examples for forex, gold and Bitcoin, plus the mistakes that blow up accounts.