
In this guide
Breakouts start the biggest moves in every market. They also produce some of the most painful losses, because many breakouts are fakeouts: price pokes through a level, traders jump in, and the market snaps back. This breakout trading strategy shows you how to separate the two.
What makes a real breakout
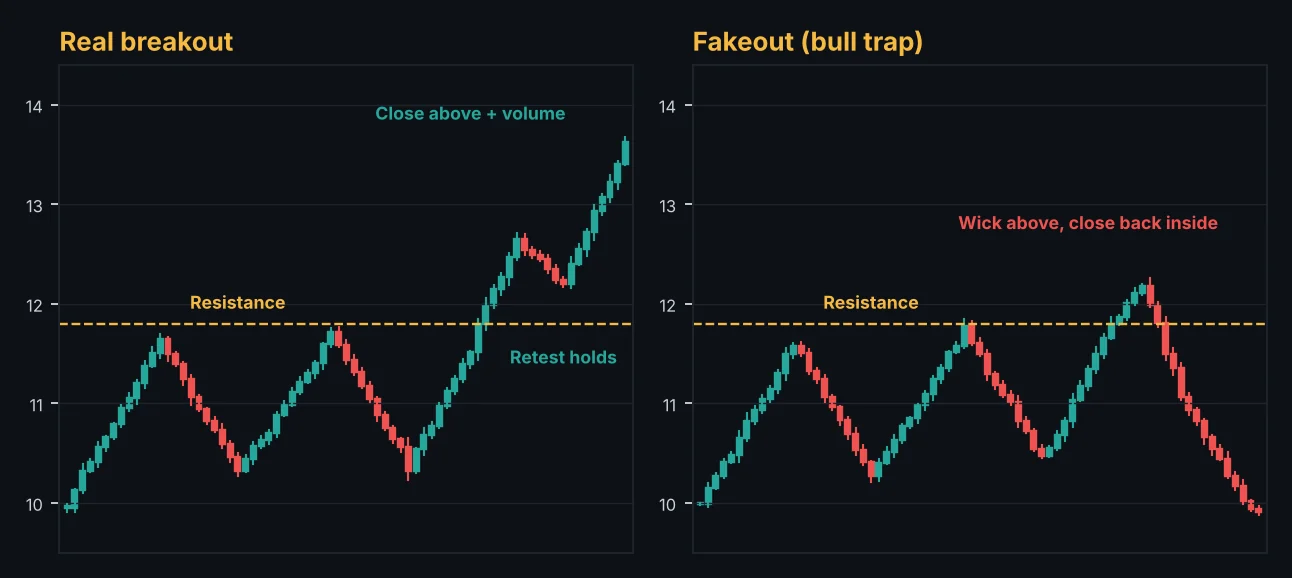
A real breakout usually has four things:
- A clear level: a range high or low that has been tested several times.
- A candle close beyond the level, not just a wick.
- Rising volume on the breakout candle.
- Support from the higher timeframe trend. Breakouts in the direction of the daily trend work far more often.
What a fakeout looks like
A false breakout (bull trap above resistance, bear trap below support) often shows:
- A long wick through the level and a close back inside the range.
- Low or falling volume.
- A breakout right before major news or in a quiet session.
- A level with a cluster of obvious stop losses, which large traders target (a liquidity sweep).
Fakeouts are also opportunities: when price sweeps above a range and closes back inside, the move often runs all the way to the other side of the range.
Best Trades: the top setups in every market with entry, stop loss and two targets, updated all day.
The breakout-retest entry
The most reliable way to trade breakouts is to wait for the retest:
- Price breaks the level with a strong close and volume.
- Price comes back to test the level from the other side.
- A rejection candle forms (a wick or engulfing candle) at the level.
- Enter in the breakout direction, stop on the other side of the level, target the next level or the height of the range projected from the breakout.
You will miss some breakouts that never retest. That is the price of avoiding most fakeouts.
Aggressive entry for strong markets
In very strong trends, some traders enter on the breakout candle close. If you do this:
- Only trade in the direction of the higher timeframe trend.
- Require clearly above-average volume.
- Use a smaller position and a stop below the breakout candle.
Risk, reward, ratio and break-even win rate. Free, no sign-up.
Open the risk reward calculatorTiming: sessions and news
- Forex and gold: breakouts during the London open and the London and New York overlap follow through more often than breakouts in the Asian session.
- Crypto: breakouts during the US session tend to be stronger. Weekend breakouts are more often fake.
- News: avoid breakout entries minutes before CPI, payrolls or Fed decisions. Wait for the first reaction to settle.
Measuring the target
A simple target is the height of the range projected from the breakout point. If a range is 200 pips tall, the first target of an upside breakout is 200 pips above the breakout level. Take partial profit there and trail the rest.
Let Alice watch the levels
The Alice scanner flags breakouts with volume spikes and trend agreement across timeframes, and breakout alerts (Premium) notify you the moment a market breaks a key level, so you can check for the retest instead of watching charts all day.
Free daily analysis, key levels and market updates from the Alice team.
Frequently asked questions
How do I know if a breakout is real?
Look for a candle close beyond the level, rising volume, agreement with the higher timeframe trend and, ideally, a successful retest.
What is a bull trap?
A bull trap is a false breakout above resistance that quickly reverses back below it, trapping traders who bought the breakout.
Where do I put my stop loss on a breakout trade?
On the other side of the broken level, beyond the retest wick, so a normal pullback does not stop you out.
Which timeframe is best for breakouts?
Breakouts on the 4-hour and daily charts are more reliable. Use the 15-minute or 1-hour chart to time the retest entry.
This guide is for education only and is not financial advice. Trading involves a high risk of loss. Test any method on a demo account first and never risk money you cannot afford to lose.
Keep learning
 Strategy
Fibonacci Retracement Trading Guide: Levels, Golden Zone and Targets
How to draw Fibonacci retracements correctly, which levels matter (38.2%, 50%, 61.8%), how to use the golden zone for entries and extensions for targets, with examples.
 Strategy
How to Use a Market Scanner to Find Better Trades Faster
A practical guide to market scanners for crypto, forex and gold. What a scanner score means, how to filter by timeframe, how to go from a scan to a planned trade, and the pitfalls to avoid.
 Strategy
Order Blocks and Fair Value Gaps: The Smart Money Concepts Strategy Explained
Learn the SMC strategy step by step: order blocks, fair value gaps (FVG), liquidity sweeps, break of structure (BOS) and change of character (CHoCH), with entries, stops and targets.